









Originally published: 22nd March 2023
Variance analysis is an easy to use management tool that helps achieve business goals and improve operational efficiencies. Performing a month-end variance analysis will show that your business or project is moving ahead according to your plan. Month-end reporting becomes more useful when variance analysis is connected to commentary, forecasts and management decisions.
This guide discusses the benefits of month-end variance analyses, how to perform one and shares tips for action oriented best practice.
Executive Summary
Month-end variance analysis helps finance teams compare actual performance against budgets, operational targets, forecasts and prior periods. It shows where the business is ahead of plan, where performance is falling behind, and which variances need explanation or action.
Done well, variance analysis is more than a reporting task. It helps leaders understand how and why performance changed, whether the change is temporary or recurring, and what decisions should follow.
Many organisations still do their variance analysis in Excel, and it works at a small scale. But, as businesses grow, variance analysis too becomes more complex and the process becomes overly dependent on manual data consolidation. This can significantly slow things down and make it harder to trace related actions later for audit.
This guide explains how to perform month-end variance analysis and how to interpret favourable and unfavourable variances. It guides you on setting materiality thresholds, writing useful variance commentary and updating forecasts. It also shows how MODLR helps finance teams automate a significant part of the variance analysis process. Moving beyond manual spreadsheets and connecting data, MODLR highlights material variances, supports collaboration and produces faster management reports.
What this Guide Covers:
- Executive Summary
- Introduction
- What is a Variance Analysis?
- How Do I Use a Monthly Variance Analysis?
- Important Factors in Performing a Monthly Variance Analysis
- How to Set Up Month-End Variance Analysis in Excel
- Limitations of Month-end Variance Analyses in Excel
- Doing Your Month-End Variance Analysis in MODLR
- Conclusion
- Frequently Asked Questions About Month-End Variance Analysis
- Want to see MODLR in action?
Introduction
Variance analysis is an easy to use management tool that helps achieve business goals and improve operational efficiencies by helping explain actuals vs budgets in a more organised manner.
A strong monthly variance analysis helps decision makers understand where performance is ahead of plan, where it is falling behind expectations, and what actions are needed to get things back on track.
Month-end reporting becomes more useful when finance teams can connect actuals, budgets, forecasts and commentary within a connected planning environment. For FP&A teams, variance analysis is also a key part of month-end reporting, forecast updates and business performance reviews.
This guide discusses the benefits of a month-end variance analysis and how to perform one. It shares tips for best practice and explains how versatile features of MODLR helps you make the most of your data for routine monthly variance analysis, management reporting and forecasting.
What is a Variance Analysis?
Month-end variance analysis is used to compare budget vs actuals in a business. It compares what actually happened during a reporting period against what was planned in the budget, forecast or when compared with the previous period.
In simple terms, variance analysis is the process of comparing two or more sets of data to identify differences. Businesses use month-end variance analysis to understand how different aspects of their operations are performing. It helps finance teams and business leaders see what is going according to plan, what is falling behind expectations, and which areas may need further investigation and follow up action.
It is finance best practice to perform month-end variance analysis to compare actual monthly results against budgets, forecasts or prior-period figures to identify material differences. This makes financial variance analysis useful for reviewing revenue, expenses, margins, cash flow, working capital and other key business performance measures.
For finance and FP&A teams, variance analysis is not just about explaining what changed. It is also about understanding why performance changed, deciding what action is needed, and using those insights to improve future forecasts, budgets and management reporting.
Routine variance analysis can be performed monthly, weekly, quarterly or annually, depending on the needs of the business. When used well, variances can help identify potential trouble spots before they become bigger problems. Significant variances may point to operational disruptions, delays, discrepancies, fraud risks, cost overruns, revenue shortfalls or other issues that require management action.
What Are Favourable and Unfavourable Variances?
In a variance analysis, results can fall into one of three categories: favourable variances, unfavourable variances, and figures that remain broadly in line with the budget, forecast, milestone or previous period.
A variance should not be judged on just the number - value or percentage - alone. The more important question is what the variance means for the business and what action should be taken about it.
A favourable variance may show that performance is ahead of plan, but finding out how it occurred is still important.
An unfavourable variance may signal a problem, but it may also reflect timing differences, seasonality, one-off costs, external market changes or an unrealistic budget assumption.
This is why drilling into specific variances is important.
Finance teams should use variance analysis as an action tool, rather than a mere reporting exercise. Each material variance should be reviewed to understand the cause and assessed for its business impact. It is necessary to decide whether and what action is needed. It is also necessary to decide if the budget, forecast or operating plan should be updated to be more relevant.
For example, higher-than-budgeted sales may be favourable, but the business should still ask why sales increased. Was it due to higher demand, better pricing, a successful campaign, timing of orders, or a one-off event? Similarly, higher expenses may be unfavourable, but the explanation matters. The increase may be caused by planned growth, higher input costs, additional headcount, delayed supplier invoices or poor cost control.
The purpose of identifying favourable and unfavourable variances is, therefore, not simply to label results as good or bad. It is to help management understand what changed, why it changed, whether it is likely to continue, and what decisions need to be made to deal with the changes.
What are Favourable Variances?
Favourable variances are differences from the budget, forecast, milestone or previous period that are beneficial to the business.
Examples of favourable monthly variances may include:
- Sales volumes achieved in June were higher than budgeted June volumes.
- Material purchase costs for June were lower than budgeted.
- Gross profit margin improved because selling prices increased or input costs fell.
- Customer collections were stronger than expected during the month, which improved cash flow.
- A project milestone was completed ahead of schedule or below budget.
A favourable variance is usually good news, but it should still be investigated.
Understanding what caused the positive result can help the business repeat the success, revise future forecasts, adjust targets or identify whether the improvement was only temporary.
What are Unfavourable Variances?
Unfavourable variances are differences from the budget, forecast, milestone or previous period that are not beneficial or adverse to the business.
Examples of unfavourable monthly variances may include:
- Staff turnover (people leaving the company) in June was much higher than the normal monthly range or higher than in June of the previous year.
- Sales returns in a certain month were significantly higher than previous or comparable past periods.
- Sales revenue was below budget because order volumes were lower than expected.
- Distribution costs increased because of higher fuel prices or inefficient delivery routes.
- Material costs exceeded budget because supplier prices increased or urgent purchases were required.
An unfavourable variance does not always mean poor performance. It may be caused by market conditions, timing differences, unrealistic budgets or external factors that are outside management’s control.
However, material unfavourable variances need to be reviewed quickly so the business can correct avoidable issues, and take action before the impact becomes larger. In some instances, such as global fuel price increases, it may be necessary to revise forecasts to reflect market conditions and realities. Doing so helps make future variance analyses more meaningful.
What is the Materiality of a Variance?
Materiality in variance analysis means deciding whether a variance is significant enough to investigate. Not every difference between actuals and budget needs action. Companies and finance teams use materiality thresholds - acceptable levels in variances - to identify which variances are large enough, unusual enough or important enough to require explanation, corrective action or a forecast update.
Every business encounters some level of variance in their key performance indicators (KPIs) from one reporting period to the next. For example, monthly sales revenues may go up and down. Manufacturing and purchase costs may show fluctuations over a year. More employees may tend to leave a company during certain periods of the year, and more new entrants will join at other times. There are likely to be higher sales and, consequently, higher levels of sales returns during the Christmas season.
This means that each line item in the budget, and each milestone in a project will have variances of some degree or another. That is to be expected.
What are Materiality Thresholds in Variance Analysis?
The role of variance analysis is to highlight the more significant variances that may spell good news or bad news for the business. What matters is the degree of the variance. That is what makes it material, or significant, and worthy of attention.
To know what is significant, and what variances can be ignored, each company must set its own materiality thresholds, for different items. This may be a percentage or a range within which the variance does not raise a flag for alarm.
Here are some examples of materiality thresholds in variances set by one company:
- We can tolerate a 5 percent variance up or down in our monthly sales.
- We should expect up to 10 percent increase in purchase costs this quarter purely because the cost of our materials has gone up in the global market.
- Our travel, transport and shipping costs are going to be much higher this year because global energy costs are up. And we should adjust our usual 5 percent threshold for this expense element up to a more practical level. (And then we should revise it downwards again when global energy prices come down eventually).
- Our normal staff turnover is between 2.5 percent and 5 percent in any reporting period. Anything over 5 percent should be investigated.
All such thresholds are subject to change, with changes that are taking place both within the company and in the business environment.
How Do I Use a Monthly Variance Analysis?
Variance analyses are nothing more than a comparison of actual figures and expected figures. For finance teams, financial variance analysis usually compares actual revenue, costs, margins, cash flow and other KPIs of a company against budgets and forecasts for the period or against corresponding previous periods.
In FP&A, monthly variance analysis is often used to prepare a budget variance report for management, executives or the board. This report needs to take each material numerical variance and explain the cause, business impact and proposed action to deal with the variance.
Business decision makers and managers can use monthly variance analysis in a number of ways to gain better control over their operations and to improve their business performance, productivity and effectiveness.
To sum up, a business can use a monthly variance analysis for a number of purposes including:
- For performance measurement
- To monitor competitiveness
- To monitor business productivity and profitability
- To highlight developing issues and problems
- To flag discrepancies and potential fraud
- For internal and external auditors’ to perform analytical reviews
Using variance analyses for performance measurement
Monthly variances can be part of a company’s performance measurement system. Used within a broader corporate performance management process, variance analysis connects financial and operational results with targets, forecasts and management action.
Each manager's performance can be judged on how they have performed according to agreed KPIs. The variances can highlight the ability of a manager/unit head to be effective and efficient.
You can do performance analyses on any of the following and more. These measures can be reviewed through actuals vs budget analysis, prior-period comparisons or forecast comparisons, depending on the purpose of the review.
- Profit margins
- Sales volumes
- Product pricing
- Regional and product line sales
- Monthly expense schedules
- Productivity indicators
- Service quality indicators
- Number of complaints
- Time taken to address issues
Put to proper use as a management tool, a monthly variance analysis can help managers and businesses perform at their best.
Depending on the nature of your business or project, you can perform variance analyses at any other frequency, such as daily, weekly, quarterly or annually as suited.
Using variance analysis to highlight developing issues and problems
Monthly variance analysis can help highlight developing operational problems before they become larger risks to a business. This is one of its most important uses. When leaders and teams review material variances regularly, they are able to move beyond reporting what happened and begin identifying why performance is changing.
Examples:
- A sudden increase in delivery costs may point to inefficient routing, higher fuel usage or supplier price changes.
- A drop in sales conversion rates may show that demand is weakening, pricing is becoming less competitive or a sales campaign is underperforming.
- Higher overtime costs may indicate staffing shortages, poor scheduling or unexpected production delays.
The value of variance analysis lies in the action that follows. It is necessary to find out the exact causes for these variances in order to take action. Finance and operational teams need to investigate the cause, decide whether the issue is temporary or recurring, and agree on corrective steps.
Corrective measures may include revising forecasts, adjusting budgets, changing supplier terms, reviewing pricing, reallocating resources or escalating the issue to management.
Used well, weekly, monthly or quarterly variance analysis can help businesses detect early warning signs, respond faster and prevent small problems from becoming costly performance issues.
Using variances to flag discrepancies and potential fraud
Those companies and managers who take their monthly variance analysis reports seriously and investigate the reasons for material discrepancies will be able to correct emerging problems and potential fraud to take timely action. There is no point closing the barn door after the horse has bolted. Timely action could help prevent losses and correct performance issues.
Monthly variance analysis can help businesses spot unusual discrepancies, errors or potential fraud before they lead to larger losses. When managers investigate material variances instead of ignoring them, they are more likely to find control weaknesses, data errors or unusual transactions early.
For example:
- A sudden increase in supplier payments may point to duplicate invoices, incorrect pricing, unauthorised purchases or changes in supplier terms.
- A large difference between recorded inventory and actual stock may indicate stock losses, data entry errors, wastage or theft.
- Unusually high staff expenses or travel claims may need review if they fall outside normal monthly patterns and accepted norms.
- Revenue that is lower than expected despite normal sales volumes may suggest billing errors, missed invoices, incorrect discounts or revenue recognition issues.
Timely action is of essence when dealing effectively with such variances. Finance teams should investigate unexplained variances, check supporting documents, confirm whether the difference is valid, and escalate serious issues where necessary.
In itself, variance analysis is not a fraud investigation. But it can act as an early warning system that helps businesses prevent losses and correct performance or control issues before it is too late.
Using variance analyses to monitor competitiveness
Monthly variance analysis can help companies monitor changes in their competitiveness on an ongoing basis. Variances in sales, pricing, volumes and margins may indicate whether the business is gaining ground, losing demand, facing price pressure or being affected adversely in some other way due to competitor activity.
For example:
- A drop in sales volume may suggest that competitors are offering lower prices, stronger promotions or better availability.
- A decline in gross margin may show that the company is discounting too heavily to defend market share.
- Higher sales in one product line and lower sales in another may indicate changing customer preferences or the impact of substitute products.
- Falling revenue in a specific region may point to stronger local competition, weak distribution or poor customer retention.
- A variance between planned and actual selling prices may show that sales teams are using discounts more often than expected.
Once these trends are visible, management can decide whether to review pricing, adjust promotions, improve product positioning, strengthen customer engagement or reallocate sales and marketing resources. It is necessary to be cautious about how you interpret variances, as there may be multiple causes rather than straight forward reasons for each variance.
Watching how variances-and competitiveness-changes over time is helpful to take corrective measures before the impact becomes too large to manage.
Using variances to monitor business productivity and profitability
Monthly variance analysis can also help businesses understand whether resources are used efficiently and whether their profitability is improving or weakening. By comparing actual results against budgets, forecasts or previous periods, finance teams can identify whether changes in revenue, costs, output or margins are affecting overall performance.
For example:
- Higher labour costs without a matching increase in output may indicate productivity issues, overtime pressure or inefficient scheduling.
- Rising production costs may suggest wastage, supplier price increases, machine downtime or process inefficiencies.
- Lower revenue per employee may be an indication that staffing levels have increased faster than sales activity.
- Reduced gross profit margins may point to higher input costs, discounting, product mix changes or pricing issues.
- Rising operating expenses without a corresponding improvement in sales or service levels may indicate poor cost control.
- Improved margins may show that pricing changes, cost reductions or productivity initiatives are working.
Used this way, you are turning the variance report into a management tool. When productivity or profitability variances are material, leaders can investigate the causes, decide whether and what action is required, and update forecasts or operating plans where necessary.
Using variances analyses for internal and external auditors’ analytical reviews
Both internal and external auditors would likely perform variance analyses as part of their analytical review processes. External auditors may even ask to see the results of variance analyses performed by finance and operational divisions. Auditors use variance analyses as a way to ensure that the figures of a period under audit are free of obvious discrepancies.
For any business, performing their own variance analyses at each month end is a great idea. This helps them know any unusual or significant variances and gives them the opportunity to find out the reasons ahead of time. It helps you get your financial audit done quickly. And you do not have to find explanations for audit queries on variances months later. You would have the answers ready on hand due to your own variance analyses and conclusions.
Important Factors in Performing a Monthly Variance Analysis
To get the best out of a variance analysis, companies need bear the following in mind:
- Variance analysis must be action oriented.
- Variances are often interrelated, and nothing happens in isolation.
- Variance analysis exercises are only as good as the underlying figures you are using.
- Materiality thresholds, ranges and percentages are subject to change over time and therefore, need to be revised.
- Variances must be subject to regular reality checks to make them more useful.
Let us explore each of these points now.
Variance analyses need to be action oriented
A variance analysis is not an end in itself. A good management reporting variance analysis should lead to decisions. If a variance is significant enough, and falls outside acceptable thresholds, it is necessary to investigate the cause, assign responsibility where appropriate, and decide whether corrective action or a forecast update is needed. Performing a monthly variance analysis means nothing if it prompts no action when there are material variances. .
Some companies perform variance analyses just for the benefit of their external auditors. But variance analysis is an invaluable management tool. Leaders must understand that monthly variances are not just about looking back. It is about being prepared and looking forward. Performing a variance analysis, on a monthly basis or otherwise, is about looking back in order to understand and take corrective action towards better business performance in the future.
Variances are interrelated
All aspects of your business are interrelated. Changes in the profit and loss account, in assets and liabilities in the balance sheet and cash flow movements all impact others. This reality naturally extends to variances as well. That is why you cannot take individual expense items or KPIs on their own in order to make a sensible judgment about variances. It is important to recognise these interrelationships in order to better interpret variance analysis results.
Example 01:
The month of December may show higher levels of sales returns, both in value and number of returns, purely because there were more sales in that month.
It is more meaningful to compare the percentage of sales returns (by value or number of returns) against the value of sales and number of sales transactions. Over months and years, a company will know what levels of returns are to be expected when sales volumes increase at the year end. And this can then be a guidance for future variance analysts and managers.
Example 02:
A new or inexperienced sales manager may see a 40 percent drop in January sales compared to the previous month. While it may seem as a cause for concern or panic to the new employee, the whole company or some product lines may be experiencing similar variances each year in January. It's nothing new to experienced sales managers and executives who may be familiar with this trend.
Similar trends may be particularly relevant for companies with seasonal sales patterns, such as those selling luxury goods, toys and school supplies.
Variance analyses are only as good as the underlying figures
Variance analyses compare the actual results against a budget or the results or figures of a given period, most often the current or most recently ended, against a previous reporting period. Hence variance analyses are only as good as the underlying budgets and milestones you use in them.
The earlier example - of a 40 percent drop in actual January sales vs December sales - highlights the need for better budgeting that takes into consideration real life factors that may impact variance analysis results. Knowing there is such a seasonal trend, the sales budgets for January should have been set at more realistic levels after comparing the extent of the expected drop in January sales that occurs each year.
Your variance analyses are only as good as the facts and budgets underlying them. You’ve heard of the saying that there are “lies, damn lies and statistics”. Be sure to make sensible use of figures and statistics when performing a variance analysis.
Materiality thresholds, ranges and percentages change over time and need to be revised
When performing a monthly variance analysis, it is important to know that the materiality thresholds, ranges and percentages are subject to change over time. Keeping this in mind will help you find more nuanced explanations and to make better sense of what is going on.
Do not panic over just one variance, like in the case of the 40 percent drop in January sales from December figures. Instead, knowing the interrelatedness of variances, seek to explain it with movements in other variances.
Need for frequent reality checks
To perform a reality check against the underlying figures used in a monthly variance analysis, you must understand the factors that are controllable by an individual or unit when setting KPIs. Failing to do so will demotivate team members since you are judging them on factors that are beyond their control.
For example, there is little sense in asking the Transport Manager why the fuel expenses are out of the charts in the last quarter. Everyone knows that global energy prices have gone up significantly. And that is totally beyond that person’s control.
However, in such instances the company may be able to manage these variances better by taking on future contracts or some other mitigatory measures.
Many companies importing goods experience similar situations due to fluctuations in exchange rates. Again, companies can get future and forward contracts to manage these foreign exchange fluctuations so that the reputation and company business do not get adversely affected.
In the post-COVID-19 world, the global supply chains face constant disruptions. Some materials are in short supply; or their deliveries are delayed, causing production disruptions. There is little value in picking on the Purchasing Manager to explain adverse variances arising from these trends. Instead, the company can explore what steps can be taken to mitigate adverse impacts so that the business can operate without issues and disruptions.
How to Set Up Month-End Variance Analysis in Excel
Variance analysis in Excel is common because spreadsheets are familiar, flexible and easy to set up. However, Excel-based variance analysis becomes increasingly difficult when companies grow in size and complexity. Data comes from multiple systems. Many users need to contribute commentary. And management reports must be updated quickly.
Despite its limitations, Excel has helped many firms get the work done. But today, there are more sophisticated software platforms like MODLR that help you get variance analyses done quickly and easily, without the hassle of manual inputs thanks to basic data integrations and automated processes. As a result, management action is faster.
However, before getting into how MODLR can add immense value to the variance analysis process, let us explore how it can be done in Excel.
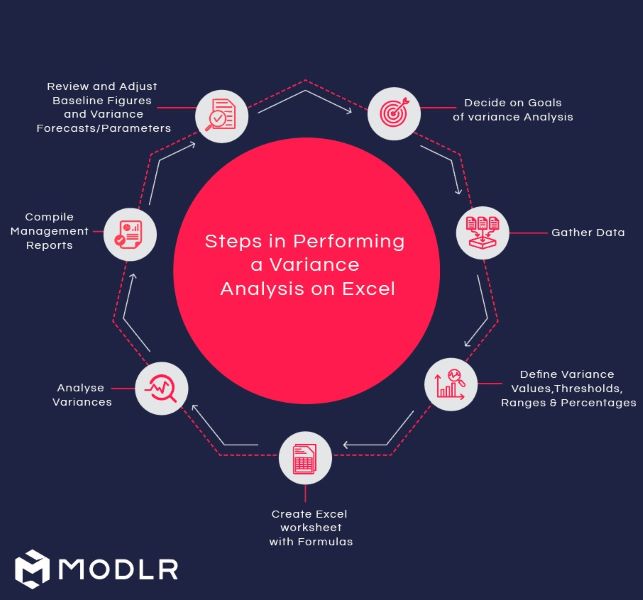
As depicted in the visual, performing a variance analysis on Excel involves multiple steps:
- Deciding on the goals of the variance analysis
- Gathering data
- Defining variance values, thresholds, ranges and percentages
- Creating an Excel worksheet with formulas
- Analysing variances
- Compiling management reports
- Reviewing and adjusting baseline figures and variance forecasts and parameters
Step 1. Decide on the goals of the variance analysis exercise
The first step, before you get bogged down in your Excel worksheets, is deciding why you are performing a variance analysis.
Most companies use their variance analyses to serve multiple purposes. The common goals for performing a variance analysis include:
- To measure and monitor performance
- For more efficient project management
- To get better operational control over the business
- To highlight developing issues and problems
- To flag discrepancies and potential fraud
- To monitor business competitiveness
- To monitor business productivity and profitability
- To provide to the internal or external auditors
Depending on your goals, the exact format of your variance analysis sheet, and the source for your data will vary.
Step 2. Gathering data
The data gathering process, and what data is necessary depends on what your goals are. To perform any kind of variance analysis you need at least two data points.
For example, if your goal is to use the monthly variance analysis for performance measurement in the sales function, you may need two or more of the following to achieve your goal.
For a basic actuals vs budget analysis, you will need reliable actual results and the corresponding budget or forecast values for the same period.
- Monthly sales budget figures in value (dollars) as well as in sales volumes/items
- Monthly budgeted sales variance parameters. That is, how much of a variance up or down the company tolerates from previous month sales (in value or percentage terms), corresponding figures from corresponding month in the previous year (level of change tolerated comparing 2022 June to 2021 June etc)
- Monthly actual sales figures for current year and for the previous year
- Actual monthly variances noted from current year (other months) and previous year
- Current month (most recently completed) sales figures in dollars and sales volumes/numbers
- If you sell a number of product lines and variants, it will be necessary to get the above data for each item.
- Data for different product lines and sales departments and individual sales people.
- Data for online, instore, branch and other sales channels.
This may seem straight forward, but when you are doing your variance analysis in Excel, that takes a lot of work, and overcoming various challenges.
Challenges in data gathering
One of the biggest challenges in data gathering for a month end variance analysis is getting data from various sources into one Excel sheet. This worksheet-dependence is one reason month-end reporting is slow in many companies. Finance teams may spend more time collecting, checking and reconciling data than explaining the variances themselves.
Some management reporting systems may be incompatible with Excel. In this case exporting data becomes a challenge, especially when frequent updates on the system require exporting again and again. Even when it can be imported, there may be issues of getting them into the necessary format.
Some variance analysts will find that they need to re enter data into Excel, which is time consuming. Data reentry can lead to errors that impact data integrity, which makes the resulting variances meaningless.
These common limitations in Excel can be mitigated to a large degree by shifting your variance analysis (and all your management reporting) onto a modern FP&A platform like MODLR.
Even organisations that do not wish to abandon Excel completely can still benefit from MODLR data integrations and the MODLR Excel Add-in. Together, these capabilities can make variance analysis faster, more accurate and easier to control.
Step 3. Defining variance parameters
By definition, a variance means how much something has varied from another data point. Before you can get started on your monthly variance analysis, it is necessary to define the variance values, thresholds, ranges and percentages that you find acceptable.
Let us explain:
In a simple budget vs actual variance analysis, the business compares actual performance against the budgeted figure for the same period.
Let us say you want to simply compare your budgeted June sales against actual June sales.
- Variance value means how much of a variance (up or down) from budget your business can tolerate. Are you okay with a $1,000 less or more from the budgeted figure of $50,000?
- Variance range and threshold means what range of a variance you are able to tolerate. You can express it as a range between $1,000 and $5,000 before it becomes a concern. If this is the case, you would be happy with a June actual sale of $45,000 or $52,000 or $55,000. But below $45,000 would be considered a cause for concern. You should also look into it if your sales are way above $55,000.
- Variance percentage means how much of a variance in percentage terms you can tolerate. You can say five percent up or down is tolerable in dollar terms. And of course, this can vary for each line item in the budget.
Step 4. Calculating variance analysis in Excel - examples
Let us take a couple of examples on calculating monthly variances.
Example 01: Sales Variances
This is a simple sales-focused budget vs actual variance analysis for a business.
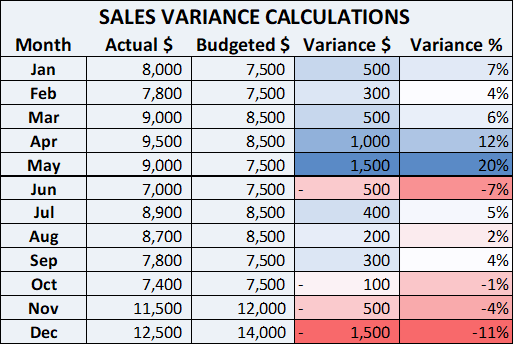
We go by the basic rules:
- The variance calculation is performed as: Actual sales - Budgeted sales. Therefore, any positive variance (where sales exceed budgets) is calculated and shown as a positive figure and positive percentage.
- The company considers sales figures over or under $1,000 to be a normal occurrence. That is, their threshold of concern is $1,000 in absolute terms, negative or positive.
You can draw many observations based on this data:
- The company has achieved their sales targets most months.
- We can see that all percentage variances above 10%, positive and negative, are highlighted as matters of concern. So are variances over $1,000.
- In April and May, the actual sales exceeded the dollar threshold (of $1,000) and the percentage threshold of 10%. They are highlighted in order to find out why. The following questions were raised: Did anything special happen? Were there any promotions? What other reasons led to actuals being significantly higher? Another point is that the company may be having special sales incentives for staff above this threshold.
Whatever the reason, it makes sense to find out why. That way the company can either learn something positive for the future or adjust budgets for the next year accordingly.
All action depends on the exact explanations received for the variance.
- In December, the company: Achieved sales figures significantly less than the budget. It was well below their $1,000 threshold. The variance is above 10%.
This calls for explanations and what needs to be done about the shortfall. For one, it could have been excessive, overly optimistic budget figures. To be sure, it is necessary to check this variance with previous years’ sales for December for a few years in the past. Either way, explanations and actions are needed.
Example 02: Sales Expenses Variances
The table shows monthly Sales Expense Variance calculations for the same company. This type of financial variance analysis helps finance understand whether cost movements are proportionate to revenue movements.
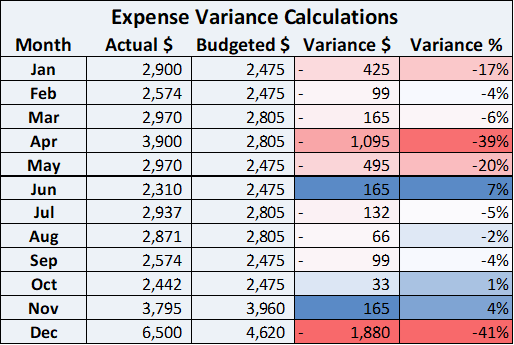
Here are the basic rules.
- The company expects sales expenses to amount to one third of their sales figures.
- As such, the budgeted expenses are calculated as: Budgeted Sales x 33%.
- The percentage threshold for sales expenses is 7%. That is, variances less than 7% up or down are acceptable.
Here are the observations:
- In most months the company expense variance percentage is less than 7. There is little concern over the sales expense variances in such months.
- In January, the actual exceeded the 7% threshold. It is necessary to find out why.
- In April, the sales expenses are over budget by 39%. It is necessary to find out why, especially considering that the sales increase that month is just 12% over budgeted figures.
- In May, while the 20% variance in expenses raises a flag, it is exactly the same increase as in the May sales figure. So, there is no further explanation or action needed because the variance is fully explained by the sales figures for the month. (This is a good example of why variances should not be considered in isolation.)
- In December, the sales expenses exceeded the budget by 41%. At the same time, December sales showed a shortfall of 11% from the budget. What is the reason for this?
- Could it be that sales promotions, such as steep discounts and price cuts, failed to deliver results?
- Perhaps the expenses were spent on activities that failed to deliver expected returns?
While seeking the explanation for this figure, it is critical to remember the interactions between sales figures and sales expenses.
- Sometimes sales drive expenses.
- At others, sales promotions and advertising expenses may be driving sales. It may be that a new product was launched with much pomp and pageantry (inflating costs) but failed to achieve expected sales levels. These things are difficult to be budgeted accurately.
- Seasonal patterns as well as relative interactions between different aspects of a business varies from company to company, industry to industry and even between product lines and variants in the same company.
The bottomline is that there is much to learn from a variance analysis regardless of whether the variances are beneficial or adverse.
Step 5. Variance commentary: Recording the reasons behind the numbers
Variance commentary is the written explanation of why a material variance occurred, what it means for the business, and what action should be taken to address the issue.
Asking why figures are the way they are and recording the commentary and discussion around the reasons and explanations given is a critical element of a variance analysis exercise.
Good variance commentary should explain whether the variance was caused by timing, volume, price, cost, productivity, seasonality, data quality or a change in business assumptions used in budgeting or forecasting. Going beyond the cause, variance commentary should also address what action or alternative actions are necessary to address the variance.
When you perform variance analyses on the MODLR platform, you get a record of the ongoing commentary and discussion in one place. MODLR keeps a record of all these decisions and actions in an easy to refer format for future reference. Compare that with how an explanation that has been recorded in an isolated version of a workbook. The latter would be rather difficult to access weeks and months after the discussion.
The next step, beyond finding explanations, is to take meaningful corrective action in case of negative (disadvantageous) variances.
When the variances are positive, it is useful to learn what went right in a big way and try to replicate the positive action to improve results in the future as well.
Step 6. Compiling management reports and budget variance reports
The role of a budget variance report is to highlight the most important differences between actuals and budget. It should go on to explain the causes of the material variances, and recommend what actions can be or are being taken to address those variances.
A management reporting variance analysis should focus the attention of leadership teams on the variances that affect revenue, margin, cash flow, profitability, risk and strategic execution.
Creating budget variance reports and management reporting variance analysis becomes quicker and easier with modern FP&A software. MODLR’s management reporting capabilities help finance teams connect actuals, budgets, forecasts and commentary in one place, making it easy to explain performance movements and prepare reports for management, executives and boards.
MODLR’s data integration capabilities help reduce manual data collection from accounting systems, ERPs, spreadsheets and other business platforms. Scenario planning and forecasting capabilities in MODLR, including cash flow forecasting, rolling forecasts and 3-way forecasting, also help leaders move beyond merely explaining variances to updating assumptions, testing outcomes and making reality-bound forecasts.
Step 7. Forecast variance analysis and adjusting forecasts
Forecast variance analysis helps finance understand whether the forecast assumptions used still reflect current business conditions. As always, it pays to revise and adjust baseline figures as well as variance forecasts and parameters to reflect ground realities that may change from month to month.
If actual results differ significantly (materially) from the forecast, then it becomes necessary to revise sales assumptions, cost drivers, cash flow expectations or operating plans. This is also where rolling forecasts become valuable, because finance can incorporate current performance into the outlook rather than waiting for the next annual budgeting cycle.
This process is also easier on MODLR, as the decisions can be recorded for future reference without getting lost in a version of an Excel workbook, and difficult to locate later.
Limitations of Month-end Variance Analyses in Excel
The main limitation of variance analysis in Excel is not the calculation itself. It is the manual work required to collect data, maintain formulas, control versions, gather commentary and prepare reports.
These challenges often indicate that an organisation is beginning to outgrow spreadsheet-based FP&A. Our guide to Excel replacement for FP&A explains when finance teams should move core planning processes into a connected platform-and where Excel can still remain useful.
The other limitations encountered in variance analysis in Excel are:
- Budgets not always being realistic
- Labor intensive nature of the variance analysis process
- Variance commentary remaining in the Excel work book, difficult to access at a later date
- Results of the variance analysis come too late to make a difference
Let us take these issues one by one.
Budgets aren’t always realistic
In Excel and indeed in any software, unrealistic budgets can lead to nonsensical results in a variance analysis. This is why it is necessary to define goals accurately and set variance parameters carefully. These are critical for good outcomes and useful variance analysis results.
Variance analysis in worksheets is labor-intensive
Variance analysis using Excel or even Google Sheets can be time consuming and labour intensive. Automating the process, for example, with a MODLR integration, can help overcome this limitation. The hours spent collecting data, reconciling versions and rebuilding reports can also be included when calculating the potential ROI of FP&A software.
Commentary remains in the Excel workbook
Comments are critical to the variance analysis process because making sense of the variances and determining appropriate action depends on the discussion around it. Anyone who uses Excel workbooks knows the hassle of sharing workbooks up and down. In many instances, due to version confusion useful comments can fall by the wayside and be lost. This limitation in Excel worksheets can make the monthly variance analysis process unwieldy, time consuming and unproductive, especially when commentary-with the reasons for decisions taken-gets lost along the way.
Variance analysis results come too late to make a difference in future actions
When month-end reporting depends on manual spreadsheet consolidation, finance teams may lack sufficient time to investigate the reasons behind material variances before management reports are due.
Excel worksheets need to be shared around and inputs from different parties need to be consolidated into one version accurately. It can be time consuming and outright frustrating since the discussion around each variance gets stretched across a long time period rather than become a dynamic, real time process. As a result, the analysis results may come too late to make a difference.
Firms experiencing these limitations need to consider whether their current tools still support the speed, control and collaboration required at month end. When choosing FP&A software, finance leaders should assess reporting, integration, governance, modelling flexibility and finance-team ownership-not simply compare feature lists.
MODLR facilitates easy, fast, real-time dynamic discussions. And because MODLR supports large numbers of geographically dispersed users to join the discussion in real time, the decision process flows faster.
Let us explore these features in greater detail.
Doing Your Month-End Variance Analysis in MODLR
Variance analysis software like MODLR helps finance teams move beyond static spreadsheets by automating data imports and highlighting material variances quickly and easily.
When MODLR is your primary reporting platform, month-end variance analysis becomes faster and more structured. This is possible because MODLR uses Cubes - multi-dimensional data structures - to store, organise and analyse business information.
Even teams that still use Excel for variance analyses can benefit from MODLR’s Excel Add-in and data integration capabilities that connect with accounting systems, ERPs, CRMs and databases.
MODLR can support FP&A variance analysis by comparing actuals, budgets, forecasts and scenarios in a single connected planning environment. IT helps capture variance commentary, bringing it all into one place. And most importantly, MODLR supports faster month-end reporting.
Performing a month-end variance analysis becomes easier when actuals, budgets, forecasts, commentary and reports are connected in one planning environment. MODLR helps finance reduce manual data handling, focus their attention on material variances and to turn month-end reporting into a more action-oriented process.
Let us see how it all works, step by step.
Step 1. MODLR Connects Data Sources
The first step is to connect the systems that hold the data needed for variance analysis. MODLR’s data integration capabilities help bring together information from accounting systems, ERPs, CRMs, spreadsheets and databases, reducing the need for repeated manual imports.
MODLR’s seamless data integration capabilitiesdata integration capabilities helps you to automatically import and process the latest information, saving time. Operational and support teams can connect their key software platforms with MODLR, automate data imports, streamline workflows and reduce time wasted on repeated manual processes.
MODLR’s recently released Visual Scripting Engine enables finance and operations teams to build low-code data workflows, automate data imports, transform source data and update planning models with less reliance on technical support. It comes with drag-and-drop tools and over 150 ready-made components for connecting to databases, cloud storage, servers and APIs, cleaning and transforming data, and updating business models in real time.
MODLR can connect with Excel and Google Sheets as well as commonly used accounting software including MYOB, Sage , Quickbooks and Xero. It can also support integration with enterprise resource planning (ERP) and customer relationship management (CRM) platforms such as Netsuite and Zendesk. And database systems including MySQL, PostgreSQL, Microsoft SQL, Oracle DBMS, SAP HANA, IBM DB2 and Google BigQuery.
As a result, your month-end variance analysis actuals can be refreshed more efficiently, mapped into the right reporting dimensions and compared against budgets or forecasts. You do not have to rebuild spreadsheet files each month, like what you must do with Excel and other spreadsheet software.
Step 2. Import and Refresh Actuals
Once the data sources are connected with MODLR integrations, it automates the import and refresh of actuals. Then, finance has access to the current information when preparing month-end reports. It saves the hassle of calling up, requesting latest data by email or organising the data received in multiple worksheets.
For example, you can pull actual expenses from the accounting system and compare against budgeted expenses without rebuilding Excel files each month.
These integrations save time because finance can focus on explaining variances and taking meaningful action, rather than collecting, checking and re-entering the same data every month.
Step 3. Compare Actuals, Budgets and Forecasts with MODLR
MODLR supports comparisons between actuals, budgets, forecasts and corresponding prior periods. This helps to identify whether business performance is ahead of plan, behind expectations or falls broadly in line with assumptions.
And you can do this for each operational division, business unit, product group, individual products or services and their variants.
For example, with MODLR’s variance analysis software capabilities, a sales team can compare actual monthly sales against budget, forecast and the same month in the previous year to understand whether a variance is caused by performance, timing or seasonality.
Step 4. MODLR Highlights Material Variances
MODLR’s analytical tools can help prioritise variances and focus attention on the most critical items first. Instead of reviewing every movement line by line, finance teams can prioritise the largest variances, the most unusual changes and the items with the greatest (material) impact on revenue, cost, margin, cash flow or operational performance.
For example, in your month end variance analysis, MODLR can highlight a product line where revenue is 12% below budget or a department where expenses are materially above forecast. Finance teams can then drill down into the variance by product, region, customer, department or cost category to identify the underlying cause.
For instance, the 12% revenue shortfall may be traced to one underperforming region, a delayed customer order or lower sales volumes in a specific product category. All this info can be found in a matter of minutes with MODLR, whereas finding the same info in multiple spreadsheets would take hours and days.
This ability to drill down into details comes from MODLR’s use of multi-dimensional data cubes, dimensional reporting and interactive Cards. These make it possible for finance to view the same variance by product, region, customer, department, cost centre, time period or scenario without rebuilding separate reports. A high-level Card may show that revenue is below budget, while the underlying cube structure allows users to drill into the dimensions behind the variance and identify where the movement is coming from.
Step 5. Visualise Month-End Variance Analysis
MODLR’s customisable reporting and visualisation tools allow finance teams to present month-end variance analysis in a way that suits their reporting needs. Users can review variances through charts, Cards, dashboards and reports, and use visual cues to highlight the largest or most important movements. This makes it easier to spot trends, exceptions and performance movements without relying only on spreadsheet tables.
For example, a finance team can use a dashboard to compare budget vs actual results by department, product, region or business unit, then use Cards and dimensional reporting to drill into the underlying detail.
Step 6. Capture Variance Commentary
Variance analysis becomes more useful when the reasons behind the numbers are recorded clearly. MODLR can help capture all the commentary on variances between actuals, budgets and forecasts in one place. That way, important explanations are not lost in emails, spreadsheet comments or separate workbook versions; nor are key decisions on what should be done about the significant variances.
For example, a sales manager can explain that a revenue shortfall was caused by delayed customer orders, while an operations manager can explain that higher costs were caused by temporary supplier price increases.
Step 7. Collaborate With the C-Suite and Business Owners
Making sense of variances often requires input from multiple parties, including finance, operations, sales, HR, procurement, and the C-suite. Making sense of variances requires input from the people closest to the numbers. Sales may need to explain revenue and margin movements, HR may need to explain labour cost variances, operations may need to explain production or delivery costs, and the C-suite may need to decide what action should follow.
MODLR supports collaborative planning and reporting, allowing teams to work from a shared view of the numbers as opposed to each department working on separate spreadsheet versions.
MODLR’s collaborative features enable:
- Shared view of actuals, budgets and forecasts: For example, the CFO, sales director and regional manager can review the same revenue variance before deciding whether the issue is pricing, sales volume or timing.
- Cross-functional variance explanations: HR, for example, can explain labour cost variances, and sales can explain margin movements, and operations can explain production cost variances before the month-end report is finalised.
- Real-time collaboration at scale: MODLR’s large-scale, multi-site collaborative planning capability allows for geographically dispersed teams to work from the same planning and reporting environment. This is useful where hundreds, or even 1,000 users, may need to contribute to the same planning, reporting or variance analysis process.
- Variance commentary is captured in one place: MODLR can store the variance commentary generated during monthly variance analysis, creating a clearer record of explanations, discussions and decisions. Instead of relying on comments scattered across Excel workbook versions teams have a shared view of the numbers and can refer back as needed.
For example, a sales shortfall explanation can be stored with the relevant variance, making it easier to refer back during management reviews, board reporting or audit queries. - Faster C-suite decision-making: Once explanations are captured, leadership teams can immediately focus on actions instead of waiting for the reconciliations of conflicting versions.
MODLR’s collaborative features make variance analysis more than a finance reporting task. It becomes a connected management process where the right people can explain the numbers, agree on actions and update plans based on a shared understanding of business performance.
Step 8. Test Scenarios and Update Forecasts
Once the reasons for material variances are understood, FP&A teams can use scenario planning and forecasting in MODLR to test what may happen next. 3-way forecasting in MODLR will help make it clear how the financial statements will be affected by any potential decisions. This helps move variance analysis from mere backward-looking explanations to forward-looking action.
MODLR’s modelling, scenario planning and what-if analysis capabilities help decision makers evaluate different options for addressing material variances. You can test the impact of potential pricing changes, supplier cost movements, volume shifts, staffing changes or cash flow pressures before updating the forecast.
For example, if gross margin is below forecast, it becomes possible to test whether the issue is driven by selling price, sales mix, supplier costs or volume changes, and then model the impact of different corrective actions.
Read: Navigating Business Uncertainty with Scenario Planning and Alternate Strategies
Step 9. Prepare Management and Board Reports with MODLR
MODLR can help turn variance analysis into structured management reporting. MODLR’s reporting capabilities can help finance teams turn variance analysis into management-ready and board-ready reporting. Finance can prepare budget variance reports, management packs and board-level summaries using connected actuals, budgets, forecasts and commentary. Commentary, variance explanations, forecast implications and proposed actions can be brought together in a structured reporting process.
For example, a CFO can present the top five revenue, cost and margin variances with explanations, actions and forecast implications in one report.
Where board approval is required, the same connected reporting process can support clearer discussion around the causes of material variances, the options available and the decisions being recommended.
Step 10. Strengthen Auditability and Control
Month-end variance analysis should also support management reporting and governance.
Because commentary, assumptions and decisions are connected to the reporting process, finance requires a clearer record of why a variance occurred and what action was agreed upon. This is useful for internal reviews, external audit queries, management reporting and future planning cycles.
MODLR can help you have better control over changes, commentary, assumptions and reporting outputs. This creates a clear record of what changed, the reasons for the changes, who contributed to the discussion and what decisions were made.
For example, finance teams can refer back to prior-period commentary when auditors, executives or board members ask why a material variance occurred.
Conclusion
Month-end variance analysis helps turn numbers into decisions. It explains the gap between plan and reality, highlights what needs attention, and supports better forecasting, reporting and performance management.
But when variance analysis depends on disconnected spreadsheets-many companies still perform variance analyses in Excel-the process becomes slow, manual and difficult to control. Then useful variance commentary gets lost, reports arrive late, and finance staff spend too much time reconciling data instead of acting on insights.
MODLR helps make variance analysis faster, clearer and more action-oriented by connecting actuals, budgets, forecasts, commentary, scenarios and reports in one planning environment. This way decision makers and finance can focus on the variances that matter most, understand what changed, and take meaningful corrective action to help the business move forward with confidence.
Frequently Asked Questions About Month-End Variance Analysis
What is month-end variance analysis?
Month-end variance analysis is the process of comparing actual monthly performance against budgets, forecasts, prior periods or operational targets. It helps finance teams and business leaders identify where performance is ahead of plan, where it is behind expectations, and which variances need explanation or corrective action.
What is budget vs actual variance analysis?
Budget vs actual variance analysis compares actual results for a period with budgeted figures for the same period. It helps businesses understand whether revenue, expenses, margins, cash flow or other KPIs are performing according to plan.
What is the difference between monthly variance analysis and financial variance analysis?
Monthly variance analysis refers to the timing of the review. It is usually performed immediately after the end of a month.
Monthly variance analyses could cover anything from operational and time related KPIs as well as financial aspects.
Financial variance analysis focuses on financial results such as revenue, costs, profit margins, cash flow, working capital and balance sheet movements.
Why is variance analysis important for FP&A teams?
FP&A variance analysis helps finance teams explain business performance, identify risks, update forecasts and support management decisions. It turns month-end reporting from a backward-looking exercise into a forward-looking planning and decision-making process.
What is actuals vs budget analysis?
Actuals vs budget analysis compares what actually happened with what was planned in the budget. For example, finance teams may compare actual sales, actual expenses or actual gross margin against the budgeted figures for the month.
What are favourable and unfavourable variances?
A favourable variance is a difference that benefits the business, such as higher-than-budgeted sales or lower-than-budgeted costs. An unfavourable variance is a difference that has an adverse business impact, such as revenue falling below budget, costs going above budget or margins below forecast levels.
What does materiality mean in variance analysis?
Materiality refers to whether a variance is significant enough to require attention. A small variance may not need investigation, but a large variance or recurring variance may need explanation, corrective action or a forecast update.
Materiality levels, whether in value (dollar) terms or percentage terms, have to be defined by the company depending on what levels of up or down deviances they can tolerate. Typically companies set percentage and dollar thresholds for variances. Those variances below these thresholds are not considered significant. The up or down monthly variances that fall out of the thresholds merit attention and action.
How do finance teams set materiality thresholds for variance analysis?
Finance teams usually set materiality thresholds using percentage limits, value limits or business risk.
For example, a company may investigate sales variances above 10%, cost variances above $5,000, or any variance that affects cash flow, profitability or strategic targets.
What should be included in variance commentary?
Variance commentary should explain what changed, why it changed, whether the movement is temporary or recurring, and most importantly, what, if any, action is being taken. Good variance commentary does not simply repeat the number. It explains the business reason behind the variance and how to act upon it.
What is a budget variance report?
A budget variance report highlights the main differences between actual results and budgeted figures. It should show the size of each variance, whether it is favourable or unfavourable, the reason for the movement, and any action required.
Budget variance reports can be made more useful and meaningful by highlighting the material variances that call for decisions on corrective action.
How is variance analysis used in management reporting?
Management reporting variance analysis helps business leaders focus on the variances that matter most. It shows how revenue, costs, margins, cash flow, productivity or operational performance have moved against plan, and helps management decide what action is needed.
What is forecast variance analysis?
Forecast variance analysis compares actual results against forecast figures. It helps finance teams assess whether forecast assumptions are still realistic and whether sales, cost, cash flow or operating plans need to be updated.
How often should businesses perform variance analysis?
Most businesses perform month-end variance analysis as part of their monthly reporting. Some businesses also perform weekly, quarterly or daily variance analysis where performance changes quickly or where operational control is especially important. The frequency of the variance analysis depends on your business needs.
Can variance analysis help identify fraud or errors?
Yes. Variance analysis can help flag unusual movements that may indicate errors, control weaknesses or potential fraud.
For example, unexpected supplier payment increases, stock discrepancies, unusual travel expenses or revenue shortfalls may need further investigation.
What is materiality in variance analysis?
Materiality in variance analysis means deciding whether a variance is significant enough to investigate. A small difference between actuals and budget may be acceptable in ,most businesses, but a large or repeated variance may need explanation, corrective action or a forecast update. Companies usually set materiality thresholds for variances using percentage limits, value limits or business impact.
What is a budget variance report?
A budget variance report is an output of a variance analysis exercise. It compares actual results against budgeted figures for a specific period and highlights where revenue, costs, margins, cash flow or other KPIs are above or below plan. A good budget variance report should show the size of each variance, identify the more material variances and explain why it happened, identify whether action is needed and help finance teams update forecasts or management reports.
Why is variance analysis in Excel difficult?
Variance analysis in Excel can become difficult when data comes from multiple systems, formulas need to be maintained and workbook versions multiply with business expansion. It becomes difficult to make sense and get the big picture when variance commentary is spread across emails or spreadsheet comments. Due to these reasons, variance analysis in Excel can slow down month-end reporting and make audit trails harder to manage.
What are the limitations of Excel for budget vs actual variance analysis?
Excel can work for simple variance analysis, but it becomes harder to control as the business grows. Common limitations include manual data imports, version control issues, inconsistent formulas, delayed reports, scattered commentary and limited collaboration.
Read our guide to replacing Excel for financial planning and reporting..
What is variance analysis software?
Variance analysis software helps finance teams compare actuals, budgets, forecasts and scenarios in a more structured environment. It can automate data imports, highlight material variances, support commentary, enable collaboration and produce faster management reports.
How does MODLR support month-end variance analysis?
MODLR supports month-end variance analysis by connecting data sources, importing actuals, comparing actuals against budgets and forecasts, highlighting material variances, capturing commentary, supporting collaboration and preparing management reports in one planning environment.
How does MODLR help finance teams drill down into variances?
MODLR uses multi-dimensional data cubes, dimensional reporting and interactive Cards to help finance teams drill into variances by product, region, customer, department, cost centre, time period or scenario. This makes it easier to find the source of a material variance quickly.
How does MODLR improve variance commentary?
MODLR helps keep variance commentary connected to the relevant numbers. Instead of storing explanations in separate Excel files, emails or spreadsheet comments, you can record explanations, decisions and actions in one place for future reference.
How does MODLR help with forecast updates after variance analysis?
Sometimes budgets and forecasts can be simply wrong, or need adjustment. Variance analysis commentary can highlight those instances. MODLR helps finance teams move from explaining variances to updating forecasts. When actual results differ materially from budget or forecast, teams can revise their assumptions, test multiple potential scenarios and update their forecasts based on current business conditions. MODLR helps businesses create more robust, data driven forecasts.
How does MODLR support management and board reporting?
MODLR helps finance teams prepare management reports, budget variance reports and board-level summaries using connected actuals, budgets, forecasts and commentary. This gives executives a clearer view of the most important variances and the actions being taken.
MODLR’s management reporting and dashboarding capabilities help visualise variance results with reports, dashboards and charts. This makes it easier for business decision makers and strategists to spot trends, exceptions and performance movements in a way that is not possible when relying only on spreadsheet tables.
Can MODLR support collaboration during month-end variance analysis?
Yes. MODLR supports collaborative planning and reporting so finance, operations, sales, HR, procurement and the C-suite can work from a shared view of the numbers. This helps teams explain variances faster and make decisions based on the same data. You can avoid passing around Excel worksheets, version confusion, manual errors, reconciliations and delays as a result.
How does MODLR improve auditability and control?
MODLR helps create a clearer record of changes, assumptions, commentary and decisions. This supports auditability because finance teams can refer back to prior-period explanations when auditors, executives or board members ask why a material variance occurred.
Want to see MODLR in action?
- Schedule a demo today.
- Learn more about MODLR’s Variance Analysis Solution.
- Ask questions about MODLR from the MODLR Team. Get in touch with our Contact Us page or email us.