
- Product
- Company
-
Solutions
By Use CaseBy Industry
- Partnership
- Resources

MODLR shows what is driving changes in gross margin by separating the impact of volume, mix, cost, pricing and markdowns. This helps teams understand what changed and make commercial decisions with better information.
.svg)
MODLR helps identify which products, categories, suppliers, stores or periods are contributing positively or negatively to margin. Teams can quickly see where there may be opportunities to improve profitability.

Margin can be reduced by higher costs, lower selling prices, heavier markdowns or changes in product mix. MODLR highlights these movements so teams can see where margin is being lost and investigate the reasons behind it.

MODLR brings the main margin drivers together in one view, showing the movement from opening gross margin to closing gross margin. Users can see the overall waterfall and review the supporting metrics behind each movement.

MODLR allows teams to compare margin performance across different periods, products, categories, suppliers and stores. This makes it easier to identify trends, spot unusual changes and focus attention on areas that need further investigation.

Connect to your ERP to automatically pull the most recent actuals

Plan and Report on MODLR models from within Excel Workbooks.

View Audit reporting of who changed what, and when

Collect commentary on variances between actuals, budgets and forecasts

Apply business logic across models globally, not in fits and starts across specific cells in certain spreadsheets

Send emails or SMS alerts when submissions are made to the budget

Quantify the financial impact of your changing operational drivers

MODLR can adapt to different types of budgeting styles and methods, such as zero-based budgeting
MODLR Margin Waterfall Analysis takes a starting gross margin and explains how it moves to the closing result. It separates the change into the main commercial drivers, such as volume, product mix, first cost, selling price, markdowns and other margin effects. Users can compare different categories, vendors, stores, periods or products and see which factors had the biggest positive or negative impact. The waterfall chart provides the overall movement, while the supporting metrics help users investigate the underlying changes in more detail. This gives finance and commercial teams a clear view of what changed, why it changed, and which areas need attention, making it easier to support pricing, cost and profitability decisions.
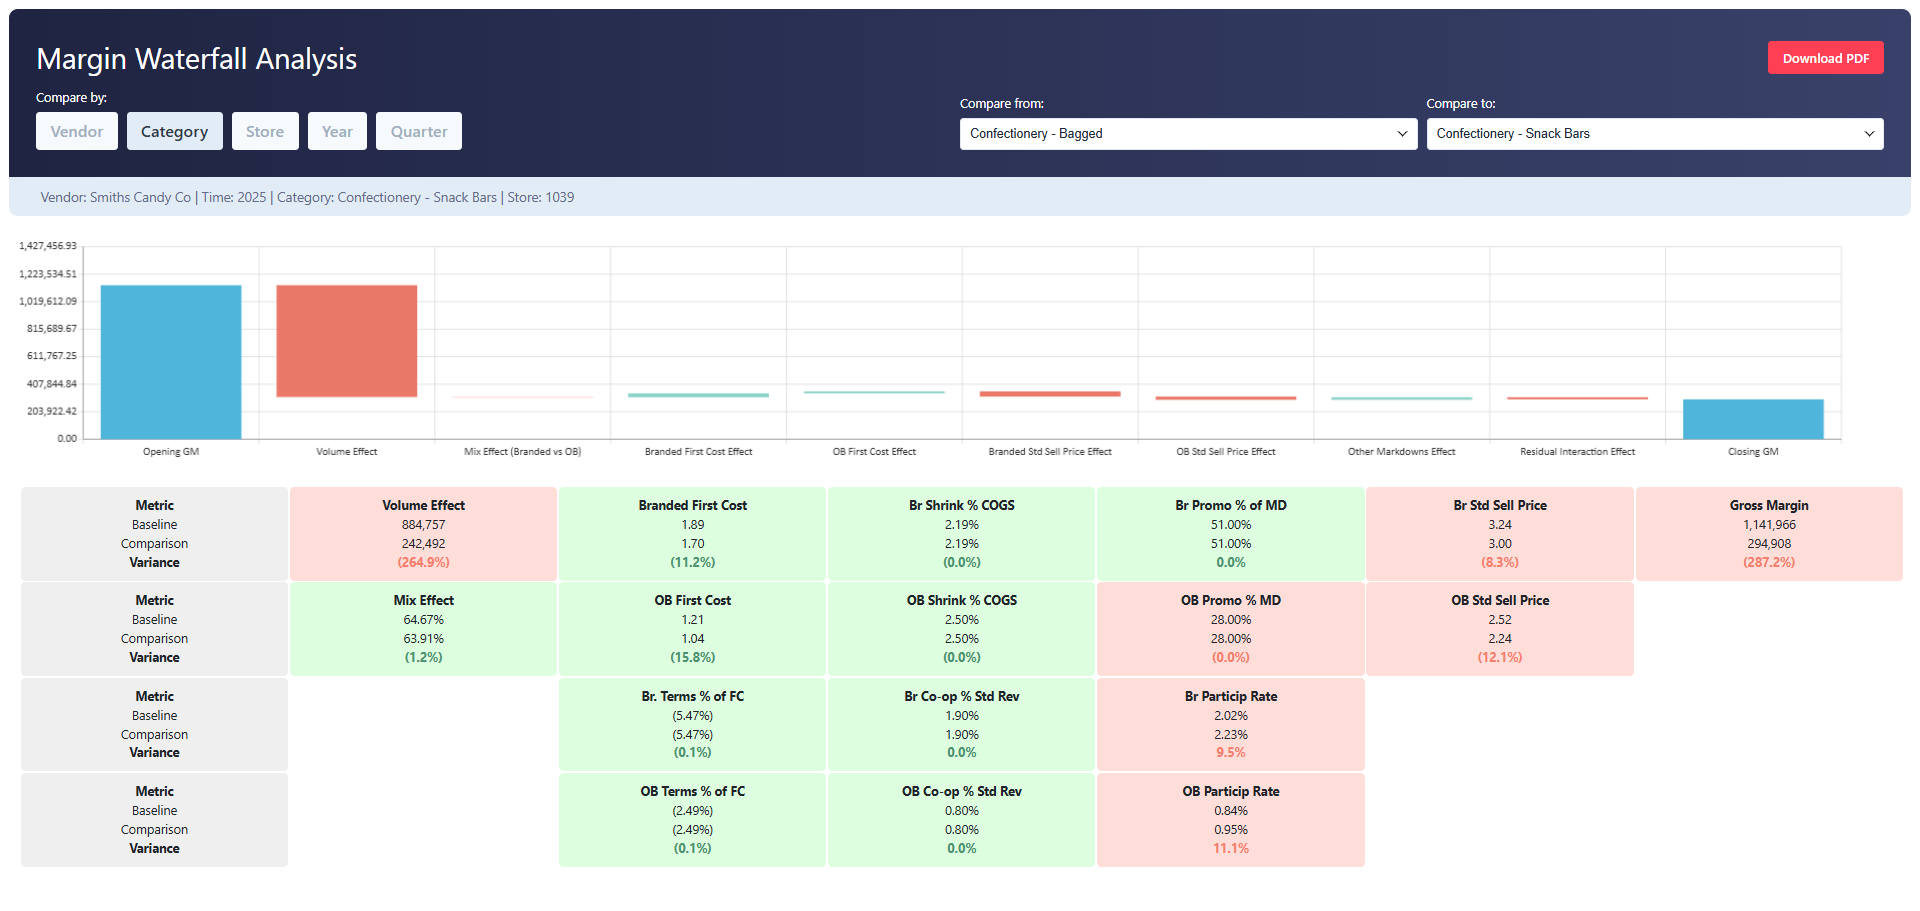
Click to enlarge
MODLR lets users compare margin performance between suppliers to understand why profitability differs. The waterfall shows how changes in volume, product mix, first cost, shrink, promotional activity and selling price contribute to the movement from opening gross margin to closing gross margin. The supporting metrics make it easier to see where one supplier is performing better or worse than another and which drivers are behind the difference. Users can then focus on areas such as pricing, cost changes, promotional terms or product mix and use the results to support commercial discussions and better margin decisions.
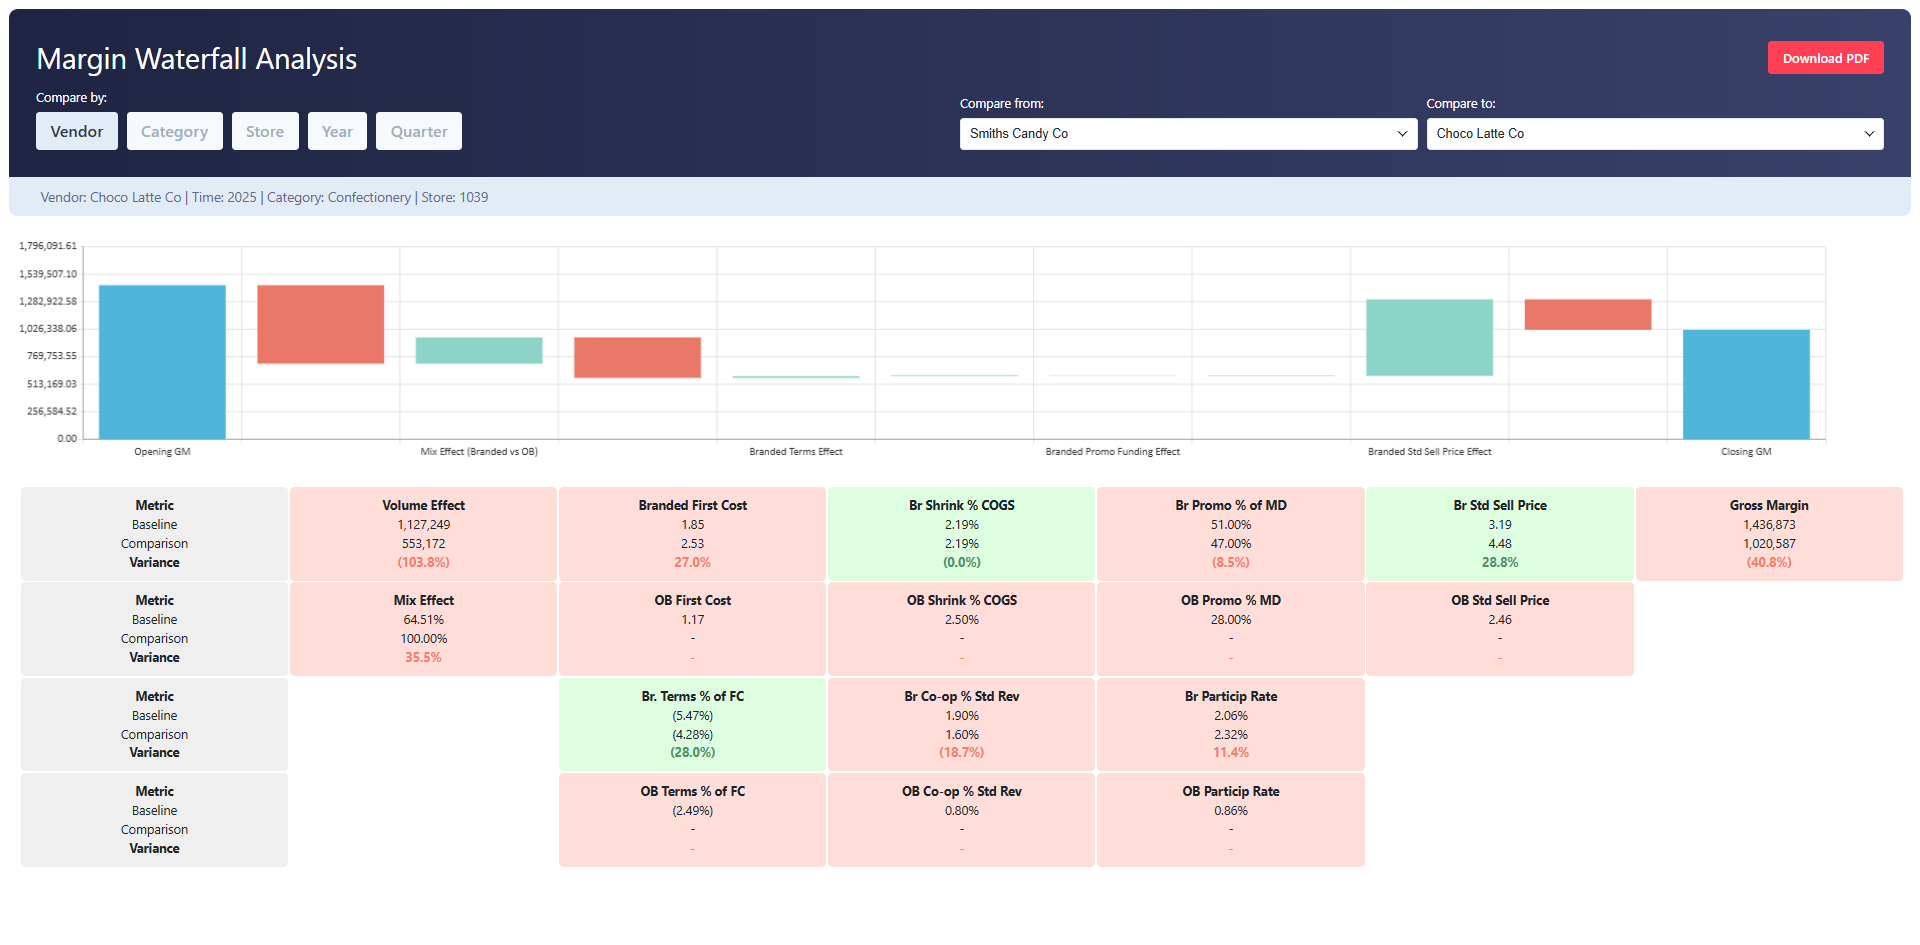
Click to enlarge
Made for every customer, MODLR can integrate with your favourite systems, boasting a wide range of pre-built integrations including Oracle, SAP, Sage, NetSuite, Microsoft Dynamics and so much more. MODLR’s data source expertise and flexible integration capabilities ensure that our cash flow forecating solution will provide you with an always up-to-date cash flow forecast.
To see the MODLR Cloud in action, schedule a personal demo with one of our modelling experts or watch an overview of the cloud platform.
Get a demo